
Information Center
Your Health. Your Family. Your Choice.
|
|
National Vaccine Information Center Your Health. Your Family. Your Choice. |
The MedAlerts Blog |
Our ability to understand information often requires us to have other, related information, in order to "get the big picture".
For example, we know that there have been 1822 Flu-related VAERS reports from the state of Illinois, and 1829 Flu-related VAERS reports from the state of Massachusetts. This information might make us think that the chance of having an adverse reaction from a Flu vaccine is the same in each state. But Illinois has about 12 million people and Massachusetts has about 6 million people, so in truth, Illinois has an adverse Flu vaccine reaction rate that is half that of Massachusetts. MedAlerts knows how to use state population information to give us a better understanding of the VAERS data (for more, see the May 2010 blog entry).
Another piece of related information that has been missing from MedAlerts (but is now available) is the number of doses of each vaccine that have been given. Without this information, it might appear that a widely-given vaccine, such as MMR, is more dangerous than a less-given vaccine (like Yellow-Fever) because there are many more VAERS reports that mention MMR. But if we consider the actual number of vaccinations that are given, it might turn out that the rate of injuries is much different.
How does MedAlerts know the number of vaccines that have been given? The CDC has actually been gathering this information for many years and making the data public (they call it "biologics surveillance"). Each year, pharmaceutical manufacturers report the number of doses distributed as well as the number of doses that are returned (hospitals and doctors can return unused doses to the manufacturer). The difference between the number of doses distributed and the number of doses returned is the net number of doses, and is considered to be the number of doses given. Of course, this figure is certainly higher than the actual number of doses given, because there must be doses that get destroyed, lost, or otherwise not actually given. Nevertheless, these figures are the best information available for determining the number of vaccines given. To see the latest dosage data that is used by MedAlerts, including references to the original CDC documents, click here.
And how can MedAlerts use this data? As usual, it is necessary to check Expert Mode in the upper-right of the search form, because seaches that use this information are specialized. Then, it is possible to apply this data by individual year, or by total reports across all years. To make a graph or table by individual year, select Year of Vaccination (dose-adjusted). To see a graph or table that considers all years, select Vaccines (dose-adjusted).
Let's make a graph of each vaccine and look at the rate of VAERS reports associated with each (across all years). Make a graph of Vaccines (dose-adjusted). It looks like this:
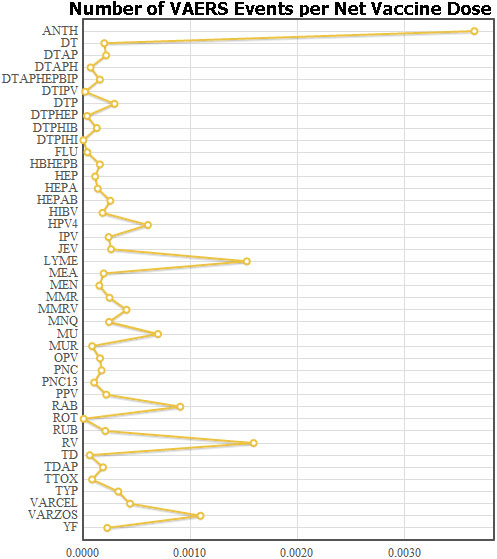
The second thing that is clear from this graph is that some vaccines have an unusually high rate of VAERS reports. The worst offender is the Anthrax vaccine, which seems to be nearly 10 times as dangerous as any other vaccine. Could it be that this vaccine is unsafe, but because it is primarily given to military personnel, its danger is overlooked when compared with the other hazards of military life?
Two other vaccines show a high rate of VAERS reports: the Lyme and the Rotavirus vaccines. Both of these were given for only a few years and then withdrawn (Lyme ran from 1999 to 2001 and Rotavirus was available only in 1998). The rotavirus vaccine was withdrawn because of side-effects (bowel obstruction) and this graph supports the suggestion that it had significant side-effects. Removal of the Lyme vaccine is attributed to "poor sales" (see page 7 of this CDC document) but considering the large number of injury reports that appeared in a very short time, it would seem that there might have been another reason for withdrawing the vaccine.
There is much to be learned by combining multiple sources of information, and MedAlerts constantly strives to do this in order to further study issues of vaccine safety. The website's new dosage data is just starting to be explored, and hopefully more useful analysis will come from it as time goes on.
<< 5/2011: Flaws in VAERS data 8/2011: Children's recommended vaccines >>
Copyright ©
2024 National Vaccine Information Center. All rights reserved.
21525 Ridgetop Circle, Suite 100, Sterling, VA 20166