April 2010: Getting multiple vaccines at one time
We live in a fast-paced society and we like to get things done quickly.
We don't want to visit the doctor multiple times to get all of our innoculations, so we get all of them at once.
Is this wise?
This month I will attempt to answer that question using data from VAERS.
Unfortunately, it is difficult to answer this question by using VAERS data because it shows only the negative outcomes that occur after a vaccination.
There is no way of knowing how many vaccinations were given that had no adverse effects.
Therefore lets ask a different question:
Does the rate of "serious" VAERS reports increase as more vaccinations are given at the same time?
What is a "serious" VAERS report?
Each report has a number of possible outcomes which include:
- Life threatining?
- Emergency Room visit?
- Hospitalized, and if so, extended stay?
- Permanent disability?
- Death?
CDC Wonder defines "serious" as any combination of Death, Permanent disability, Life threatening, or Hospitalized
(see
vaers.hhs.gov/data/instructions).
So we can answer this month's question by asking two different questions:
(1) what proportion of the VAERS reports are serious and (2) how many different vaccines were given to those people?
First we will ask for a breakdown of VAERS reports by the number of vaccines given.
To do this, go to MedAlerts and under "Show Table" set the Tabulate field to "Vaccine Count".
The results are here:
| Number of Vaccines Given at Once |
Number of VAERS Reports |
| 1 |
206,300 |
| 2 |
50,963 |
| 3 |
44,186 |
| 4 |
23,825 |
| 5 |
4,721 |
| 6 |
760 |
| 7 |
82 |
| 8 |
28 |
| 9 |
4 |
| 11 |
2 |
Most of the VAERS reports involve just one vaccination, but there are a significant number of reports in which more than one vaccine was given.
Some VAERS reports describe a surprisingly large numbers of vaccinations that were given at once (as many as 11!)
However, there are relatively few of these extreme reports,
so to simplify the analysis, we will consider only reports where 5 or fewer separate vaccinations were given at once.
Next we want to break this down according to the outcome of each VAERS report.
To do this, go to MedAlerts and under "Show Table" set the Tabulate field to "Outcome Category" and under that set the next field to "Vaccine Count".
The result is a two-level table showing the different outcomes broken down by the number of vaccines that were given at once.
Here is the first part of the table, showing the number of VAERS reports that listed a death, and the number of vaccines that were given:
| Number of Vaccines
Given at Once |
Number of Deaths |
| 1 |
2028 |
| 2 |
651 |
| 3 |
951 |
| 4 |
612 |
| 5 |
121 |
At first, it would seem that the worst thing to do is to get just one vaccine,
because the most number of deaths were reported among people who did that.
But recall that
most of the VAERS reports involved just one vaccination, so in order to make sense of the numbers,
it is necessary to "normalize" them, dividing the number of deaths by the total number of VAERS reports.
Doing this gives different numbers:
| Number of Vaccines
Given at Once |
Number of Deaths |
Number of VAERS Reports |
Deaths per Report |
| 1 |
2028 |
206,300 |
0.00991 |
| 2 |
651 |
50,963 |
0.01287 |
| 3 |
951 |
44,186 |
0.02167 |
| 4 |
612 |
23,825 |
0.02593 |
| 5 |
121 |
4,721 |
0.02588 |
Now the numbers make sense.
And not only that, they show a clear trend: when one vaccine is given, a smaller proportion of the VAERS reports show a death,
and as more vaccines are given, higher proportions of the VAERS reports show a death.
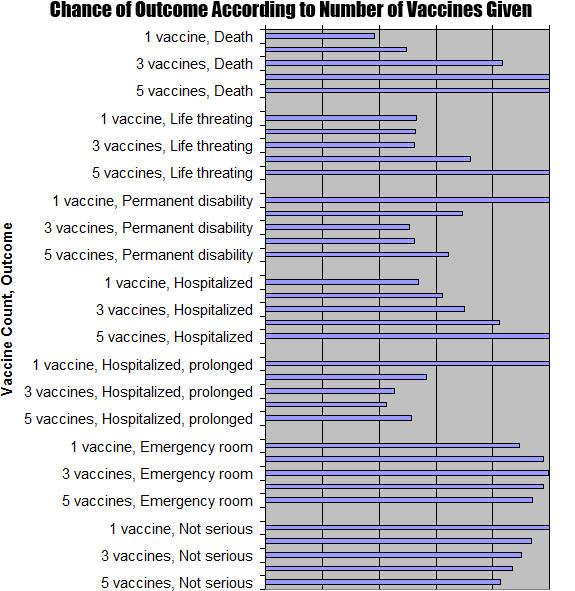
Putting all of these numbers into a spreadsheet gives the following graph.
(Note that the numbers associated with each outcome are so very different,
that it is necessary to do a second pass of normalizing to make the bars in each category have similar lengths.
Without this, some categories would have all of their bars be very short and others would have very long bars.)
What does this graph show?
Let's discuss each category separately:
-
Death. This shows a clear trend toward increased chance of death as more vaccines are given at once.
-
Life threatening. This also shows a trend toward increased liklihood as more vaccines are given at once.
-
Permanent disability. This shows no definite trend, and in fact there seems to be an indication that single-vaccination reports are worse.
This is the only outcome that does not follow the same trend, but it does not follow a reverse trend, either.
Instead it is somewhat random.
-
Hospitalized. This again shows a clear trend: increased chance of hospitalization as more vaccines are given at once.
-
Hospitalized, prolonged. This does not show a trend toward increased liklihood as more vaccines are given at once.
However, this outcome is often reported incorrectly (there are very few reports of Prolonged Hospitalization,
and many of them incorrectly fail to mention that the patient was hospitalized at all).
-
Emergency room. This shows an inconclusive result, but still shows a preference for single-vaccination situations.
But consider that Emergency Room visits are not considered serious, so this result is not relevant.
-
Not serious. MedAlerts reports this outcome when none of the others apply.
Here we see a reverse trend, showing that more reports are Not Serious when fewer vaccines are given at once.
Of course, this actually reinforces most of the other trends in the graph.
In conclusion, VAERS data seems to show that getting multiple vaccines in a single
office visit may not be as safe.
Concerned patients should discuss this with their doctor.
<< 3/2010: Flu-related VAERS events and age
5/2010: VAERS maps and state population >>