January, 2013: Yearly wrapup
Another year of VAERS data has been published by the government, so it's time for a yearly wrap-up.
As I have done in past years, I will look at the number of VAERS events that have been posted since the start of the program in 1990.
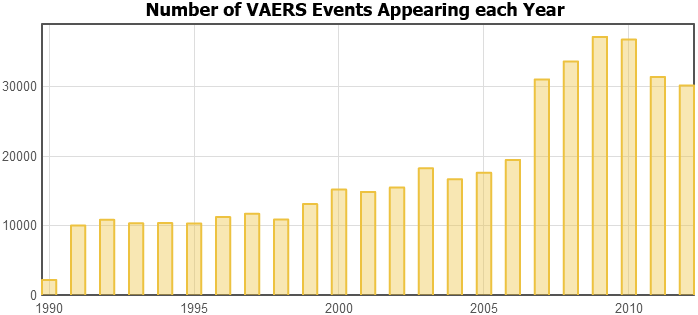
The search is simple: a Graph of Year of Appearance (the year in which a particular VAERS event appeared in the data):
The graph shows a continuing trend for the past two years: there are fewer VAERS reports being filed.
Last year showed a nearly 20% drop and this year continues that trend.
What changed?
Let's look at individual vaccines.
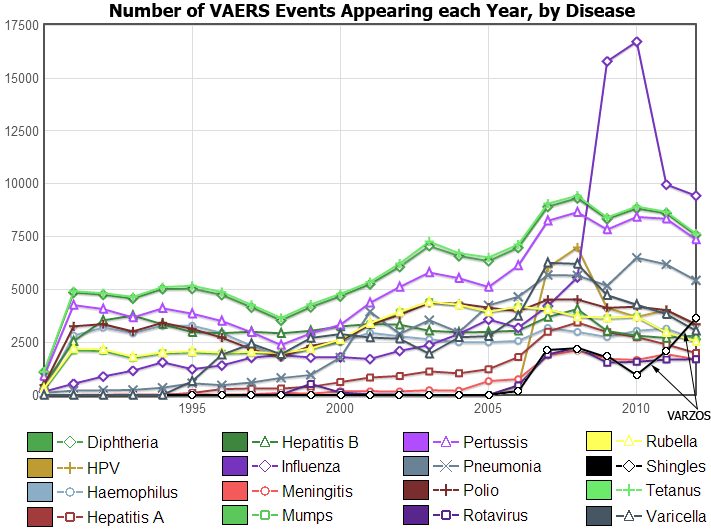
Make a Graph of Year of Appearance and Vaccine Type (the Vaccine Type is the disease that the vaccine prevents).
The graph shows that there were fewer reports for nearly all of the vaccine types.
There are a number of possible explanations for this:
-
Fewer people are getting vaccinated.
There are reports
suggesting an increase in undervaccination (some reports suggest that this is significant among children enrolled in an HMO).
However, if this were a widespread trend, the CDC would be raising alarms and reporting declining vaccine uptake rates.
This has not happened.
-
There are fewer people to vaccinate.
If birth rates decline, then there will be fewer children to vaccinate and fewer adverse reactions to report.
Birth rates have declined, but there is no data to suggest that this trend is of a significant size to explain the decline we are seeing in VAERS reports.
-
Vaccines are safer.
If this were the case, then it would mean that manufacturers have changed their production methods to improve safety,
and then there would be reports of these changes (which there are not).
Also, if this were true, as production methods improved, only selected vaccines would result in declining VAERS reports.
But since the decline in VAERS reports is across the board, it is unlikely to be due to changes in vaccine manufacturing for specific vaccines.
-
Underreporting has increased.
Could it be that even fewer vaccine reactions are being reported than in previous years?
Are doctors, manufacturers, and the public increasingly unwilling to admit that an adverse reaction could be related to a vaccine,
and take the time and effort to report the reaction to VAERS?
Or could it be that fewer people aware of VAERS, and the fact that there is a law requiring them to report vaccine reactions?
As a side note, there is one vaccine that has not followed this declining trend: the Shingles vaccine (code name VARZOS, introduced in 2006).
Let's look at this vaccine more carefully.
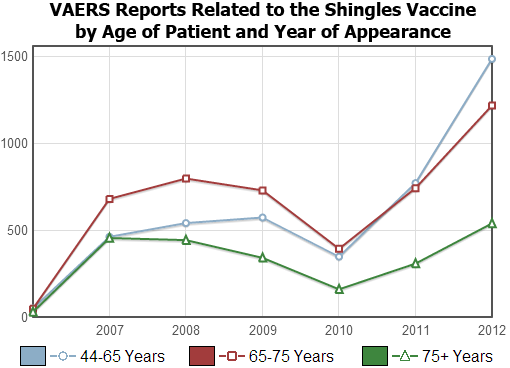
The graph below plots the Year of Appearance and Age.
Shingles affects older people, and can be quite painful.
The graph shows that all of the older age groups experienced a higher-than-usual incidence of Shingles-related VAERS reports last year.
Is the vaccine dangerous, or are people just now starting to get the vaccine, causing a higher than usual number of reactions?
It is impossible to tell at this point, because dosage data is unavailable for 2011 and 2012.
But some people should not get the vaccine,
as even the CDC acknowledges.
So if you are considering getting the Shingles vaccine, check out the warnings before insisting on the shot.
<< 11/2012: Vaccines with High VAERS Rates
4/2013: Symptoms of Flu and HPV >>
Copyright ©
2025 National Vaccine Information Center. All rights reserved.
21525 Ridgetop Circle, Suite 100, Sterling, VA 20166


