Information Center
Your Health. Your Family. Your Choice.
 |
National Vaccine Information Center Your Health. Your Family. Your Choice. |
The MedAlerts Blog |
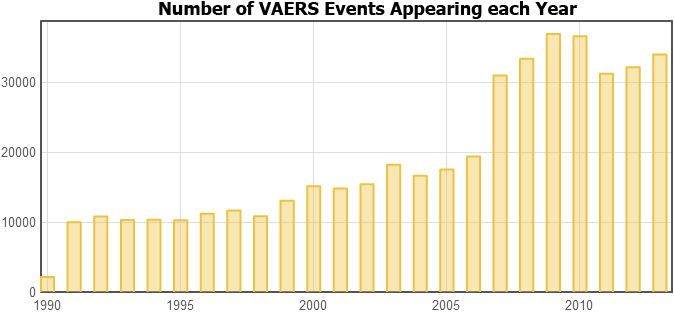
Another year of VAERS data has been published by the government, so it's time for a yearly wrap-up. As I do every year, I will look at the number of VAERS events that have been posted since the start of the program in 1990. The search is simple: a Graph of Year of Appearance (the year in which a particular VAERS case appeared in the data):

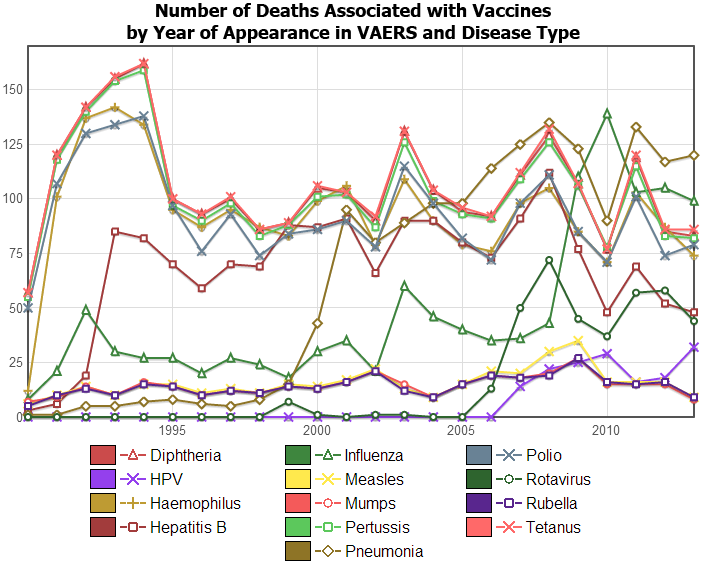
This year, I'm going to take a different view of the VAERS data over its quarter-century history. Let's look at reports in which a person died after getting a vaccination. Make a Graph of Year of Appearance and Vaccine Type. This will list vaccines by type (the disease they address). In addition, set Died? to Yes in Section 4 of the search form (Event Characteristics). The graph looks like this (with insignificant diseases removed):

But the vaccine associated with the largest growth in deaths last year is Human Papillomavirus (HPV, the purple line). Last year, another 32 cases were reported in which a patient died after an HPV innoculation, bringing the total to 157 deaths. Remember that Influenza and Pneumonia shots are given yearly, and nearly every child is given DTP, Polio, and other innoculations (often multiple times because of the need for booster shots). But the HPV shots are given once (a series of three shots), and only to those who elect to take it. This makes the rise in associated deaths stand out from the rest.
Copyright ©
2026 National Vaccine Information Center. All rights reserved.
21525 Ridgetop Circle, Suite 100, Sterling, VA 20166