Information Center
Your Health. Your Family. Your Choice.
 |
National Vaccine Information Center Your Health. Your Family. Your Choice. |
The MedAlerts Blog |
This month I will explore onset intervals, the number of days between taking a vaccination and getting adverse symptoms. I will examine VAERS data by asking this question:
As my January 2010 report showed, examining the database by looking at all of the 70 different vaccines shows way too much information to examine clearly. The solution is to graph vaccine types instead. This groups the vaccines according to the diseases they are attempting to prevent. Since there are only 27 different diseases, the graph is easier to analyze.
So for each vaccine type, we want a plot of the number of VAERS events that have a particular onset interval. To do this, check "Show Graph" (in part 1 of the search form) and under it graph "Onset Interval" and "Vaccine Type". You can uncheck "Show Table" and "Show Event Details".
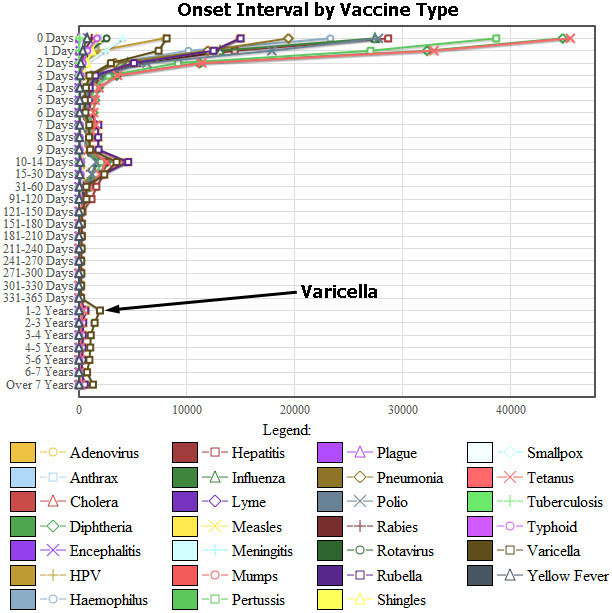
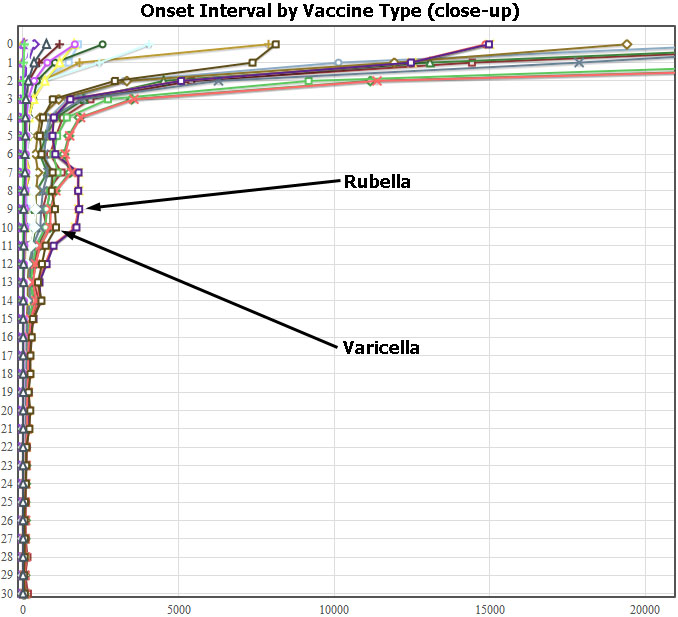
Here is the graph (ignoring the "unknown" onset intervals):


But the first graph shows another spike that happens years after the vaccine has been given, and it happens only for varicella. This vaccine seems to have extremely long onset intervals, and the graph shows that there are thousands of reports of damage that happen years after the innoculation.
What is going on?
A look at the reports shows two unfortunate reactions:
Can the varicella vaccine cause shingles? When I did my original research for this this article, just a few months ago, I found a document on the CDC website (www.cdc.gov/vaccines/vpd-vac/varicella/faqs-nipinfo-varicella.htm) which had this in it:
|
Varicella vaccine is a live virus vaccine, and may result in a latent infection, similar to that caused by wild varicella virus. Consequently, zoster in vaccinated persons has been reported. Not all of these cases have been confirmed as having been caused by vaccine virus. The risk of zoster following vaccination appears to be less than that following infection with wild-type virus. However, longer follow-up is needed to assess this risk over time. |
This statement is no longer available on the CDC website, but it can be found at the Internet 'wayback machine' which saves old copies of web pages. A 2005 New York Times article also discusses this problem.
So even if the CDC no longer believes that the varicella vaccine can cause shingles, it still seems to be the case from the VAERS data.
<< 7/2010: Countries that banned H1N1 Flu vaccine 9/2010: Flu season preview >>
Copyright ©
2026 National Vaccine Information Center. All rights reserved.
21525 Ridgetop Circle, Suite 100, Sterling, VA 20166