
Information Center
Your Health. Your Family. Your Choice.
 |
National Vaccine Information Center Your Health. Your Family. Your Choice. |
MedAlerts.org |
| Normal Usage: | Expert Mode: |
| Introduction | Introduction |
| Presentations | Presentations |
| Choosing Cases | Choosing Cases |
| Examples | Symptoms |
When in Expert Mode (the checkbox in the upper-right corner) there are many more choices for how search results can be presented.
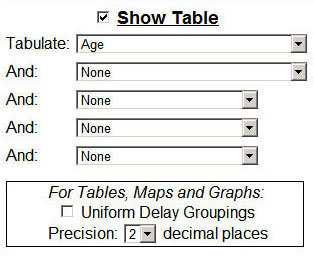
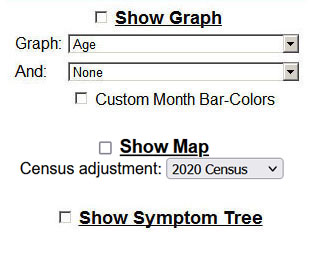
MedAlerts is able to show graphs and tables of the number of VAERS reports per dose of vaccine administered. This is done by selecting special "dose-adjusted" Graph and Table factors: Vaccines (dose-adjusted) and Year of Vaccination (dose-adjusted).
For example, if there are 1,000,000 doses given, and 500 VAERS reports, then the ratio is 500 / 1,000,000 = 0.0005 VAERS reports per vaccination.
Click Here to see the dosage numbers being used.
When choosing Vaccines in Section 3, it is possible to request that the listed vaccines not be selected. For example, if you want to see all vaccine products except for FLU, then select FLU and click on Excluded.
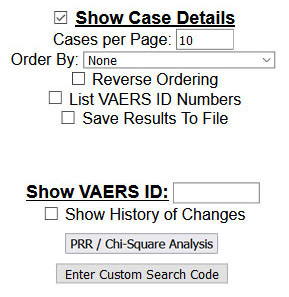
When Case Details are requested, there is a choice of how to order them. You can also check Reverse Ordering to reverse that order.
When Case Details are requested, they are presented 10 per page. If you check List VAERS ID Numbers, then all of the ID numbers will be listed before the cases are described. Each ID number is then linked to the full details of that case..
Proportional Reporting Ratio (PRR) and Chi-square are two statistical measures that relate a cause to an effect. Here, these numbers can relate a vaccine to an outcome. Click the PRR / Chi-Square Analysis button to see a more complete explanation.
The CDC Split Type is a field that holds arbitrary text, probably from other databases. According to VAERS, it contains the "manufacturer number or immunization project number." Some of the Split Type fields also contain country codes. You can examine the entire Split Type field by selecting the Graph or Table factor: CDC Split-type.
A more advanced search is to ask to see the country codes in the Split Type. Do this by selecting: CDC Split-type country code. This looks through the Split Type fields for those with country codes, then displays those countries. For each country code, the nature of that code is provided. Those with (phh) after them are from Split Types that start with the letters "PHH." Those with (waes) after them are from Split Types that start with the letters "WAES" (probably the Worldwide Aeromedical Evacuation System).
When Tables or Graphs are made, analysis values are computed. These values are shown with 2 digits of precision to the right of the decimal point (for example "26.12"). To change this precision value, a Precision choice appears in Section 1.
When Tables or Graphs are made, you can request that the various dates associated with the case be sorted by their year, or their month and year. In Expert mode, you can request that the cases be organized by the month only. Month-only reports ignore the year of the date and examine only which month is mentioned. Reports like this can be used, for example, to ask which are the worst months for a death, and which are the most common months in which people get vaccinated. To see these results, use the special Graph and Table factors: Month (only) of Vaccination, Month (only) of Onset, Month (only) of Submission to VAERS, Month (only) of Appearance in VAERS, and Month (only) of Death.
When making a monthly graph (for example, "Month of Vaccination" or "Month of Onset") it is possible to colorize the monthly bars so that they are more easily recognizable. Of course, this applies only to bar graphs, not line or pie graphs. Choosing Custom Month Bar Colors and a monthly graph makes the following section appear in the search form:
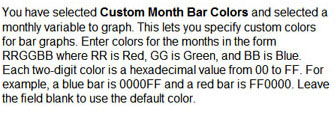
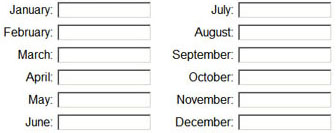
Enter color values for each month. Leave the month blank to use the default color (yellow).
In the "Case Details" part of Section 1, Expert Mode gives you a new checkbox: Save To File. This requests that the Case Details be saved to a disk file on your local computer. This file is a tab-separated text file that can be read into any spreadsheet program. If you choose this form, there will be no web output from a "Find", so no Table, Map, Graph, or Case Details will be shown.

The columns in the spreadsheet are:
Copyright ©
2026 National Vaccine Information Center. All rights reserved.
21525 Ridgetop Circle, Suite 100, Sterling, VA 20166